In this paper, after going through the benefits of standardization, various technical aspects are discussed, like what all facilities can have standardized design and what all can have site-specific designs depend on contract & site conditions. Planning & monitoring of such multiple projects in one of the project management tool, called Primavera Project Planner (P3), follow this. Savings in cost is explained in the form of case study, which shows how much percentage of cost can be saved, by designing & executing multiple projects simultaneously using standardization technique. Various factors, which can have a adverse impact on standardization, are also discussed in the later part before concluding this paper.
A: Introduction
The cost of power supplied to the end consumer comprises of components like cost of setting up the plant, operational cost, cost of transmission and cost of distribution. If the cost of power supplied to a consumer were to be reduced, the cost associated with each component would need to be reduced. If we focus on set up cost of power projects, it not only involves substantial capital investment but also the gestation period is longer compared to other industries. The project capital cost is one of the important parameter on which the unit cost of power is worked out. For the same reason, emphasis is being given on reduction of this cost and various ways has been suggested from time to time. One of the ways to achieve this is, by designing and executing multiple power projects simultaneously using standardization technique.
The purpose of this paper is to discuss practically all aspects related to standardization of a Gas fired CC based power project, followed by a case study. Though the paper details practically every aspect related with the standardization, focus will be on the capital cost optimisation from the viewpoint of owner, as it is a major factor in deciding the unit cost of power to be supplied to end consumer.
To begin with, author highlights the benefits of standardisation.
B.1 Savings in cost & time:
· Through bulk procurement of identical equipment & materials, which constitutes the major part of project, owner could negotiate lower supplier pricing for them. Also the home office job-hours required to specify and procure would be extended only on an initial project.
· The evolutionary design process leads to a family of plants, which can transfer experience from one project to the next. Standardisation, which is inherent in a family of nearly identical plants, plays a significant role in reducing construction and start-up costs and time.
· Substantial cost and schedule improvements are realised during construction as techniques are passed on, rework is reduced, more efficient methods are developed and familiarity with the design increases. This is evident at multi-unit sites where the subsequent units are completed in shorter times. The benefits of shortened construction schedules on successive units can also be demonstrated on the projects, with a six-month reduction in construction time from the first project to the third project. While influential in reducing construction cost, this shortened schedule also provides a quicker return on investment for the plant owner.
· The significant cost benefits from series development is the savings in design and engineering job hours/cost by standardising designs of major systems.
B.2 Assured Innovation:
· Standardisation based on proven technology guarantees a plant performance that leads to a reduced financial risk for the project.
Before proceeding further, it is imperative to understand the basic technical aspects of power projects, which are explained in the next section.
C: Technical aspects of power project:
Here, author has considered Combined cycle (CC) power plant, which consist of mainly a CTG, a HRSG, and a STG. Combined cycle is the technology, which uses the fuel to run the CTG and also uses wasted exhaust heat from gas turbines to produce steam that drives an additional turbine. CTG, HRSG & STG forms one power block/train and as per the power requirement, multiple trains needs to be designed. The condenser and the closed cooling water (CCW) system for each train are cooled by its corresponding circulating water system that rejects heat to the atmosphere via cooling towers. Each train includes a GSU transformer. Two generator breakers are provided for the protection of the CT and ST generators. Power is carried by isolated phase bus duct to the GSU and UAT transformers.
In the next section, author identifies systems/facilities of a CC power plant, which can be standardised. Once the design for that specific system/facility is accomplished for the first project, the team can simply adds the site-specific features to the down-the-line projects to produce a complete plant design.
D: Systems/Facilities under standard plant design
The major process systems, including the power island/block can have a standard design. Apart from power block/island, following equipment/system/facilities can be a part of standard plant design.
· Totally enclosed water-to-air cooled (TEWAC) generator. The generator can include excitation system, controls, neutral grounding equipment, and other auxiliaries required for a fully operational unit.
· Surface condenser and vacuum pumps.
· Single condensate pump.
· Closed cooling water (CCW) system.
· DCS equipment and data highway.
· Variable speed boiler feed pump.
· Continuous emission monitoring system (CEMS).
· Fuel gas treatment system (filtration, heating, and scrubbing).
· HRSG chemical feed systems.
Within the standard power block, space and connections (condensate supply and return, and electrical) can be provided for up to two condensate polisher trailers. Condensate polisher trailers are used to remove impurities from the condensate, which comes from STG. Additionally all piping and raceway that is part of the standard power block can be standardized in design.
The standard plant layout can include a standard location for the central control room building; the main step up transformers; the ammonia unloading and storage facilities; the auxiliary boiler; the CTG static start systems; the fire water pumphouse; and the space for emergency diesel generator. In addition, the standard plant layout includes a designation of the relative areas for the cooling towers, circulating water pumping facilities and the water treatment facilities. Standard designs can be used for the central control room building; the fire water pumphouse; and to the extent possible, for the cooling towers, major pumps & structures, and main transformer foundation.
In the next section, author identifies those systems, which would support one or more standard power blocks and can be considered as site specific.
E: Systems/Facilities under site specific design
Due to various site-specific criteria’s like site location, site elevation & barometric pressure, temperature conditions, soil properties etc., various facilities need to be designed as per the individual site conditions. Design for following facilities/systems, needs to be site specific.
· GSU for each power block.
· Cooling water systems, including cooling towers and circulating water pumps, to provide cooling water to the condensers and CCW system for each power block.
· Packaged auxiliary boiler with stack.
· A distributed control system (DCS).
· Make up water clarification system with recirculating solids contact clarifier, sludge recirculation and discharge pumps, and chemical feed skids.
· Filtered/fire water storage tank.
· Sodium hypochlorite injection system for makeup and circulating water microbiological control.
· Process makeup water treatment consisting of multimedia filters with chemical metering pumps, train demineralizer, regeneration and waste neutralization skid, acid feed system with tank, and caustic system with tank.
· Demineralized water storage.
· Sanitary waste collection system, lift stations.
· Fire protection system.
· Instrument air compressor and dryers.
· Yard lighting system.
· Domestic (potable) water distribution.
· Heating, ventilating, and air conditioning (HVAC) systems.
· Wastewater collection, treatment, and discharge system.
· Ammonia unloading and storage system.
· Hydrogen distributed system & trailer pads.
· Electric power distribution system including a common electrical module.
· Stormwater collection and discharge system.
· Plant communications wiring and raceway between plant buildings.
· Switchyard connected to the utility’s substation.
Though some of the above facilities can be standardised to maximise the standardisation benefits, however it depends on various aspects like above discussed site conditions and contract requirement. For the same reason author has preferred to keep them in non-standardised category.
Once it is identified that which all systems are to be standardised and which all will be site specific, the next step is to see how to manage such type of projects in some project management tool, which is explained in next section.
F: Planning/Scheduling aspects
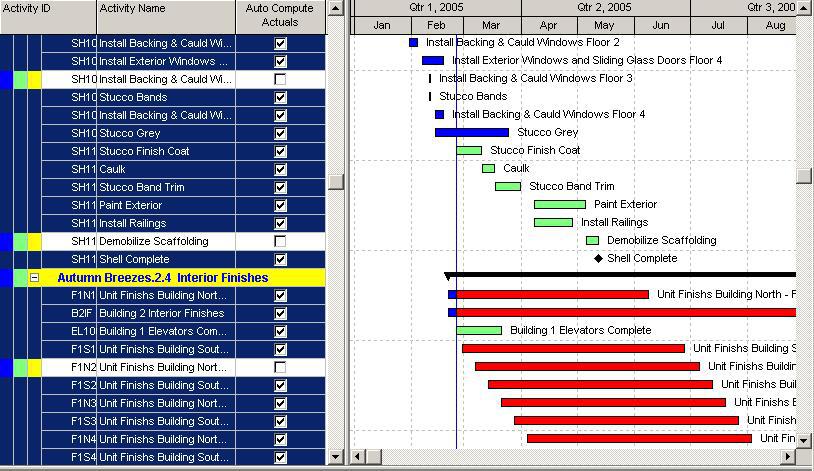
Above discussion might give an impression that 3 project schedules needs to be developed separately, which is an exhaustive process. However that is not the case. One project needs to be developed initially and can be copied to other 2 databases. This will simplify the planning efforts of project management team. Here, author shares his experience of planning and managing such type of projects in one of the project management tool called as Primavera Project Planner (P6). Author has considered 3 CC based projects, which needs to be planned. Two projects are considered to be having 4 power trains and one with 3 power trains.
F.1: Development & maintenance of schedule in P6:
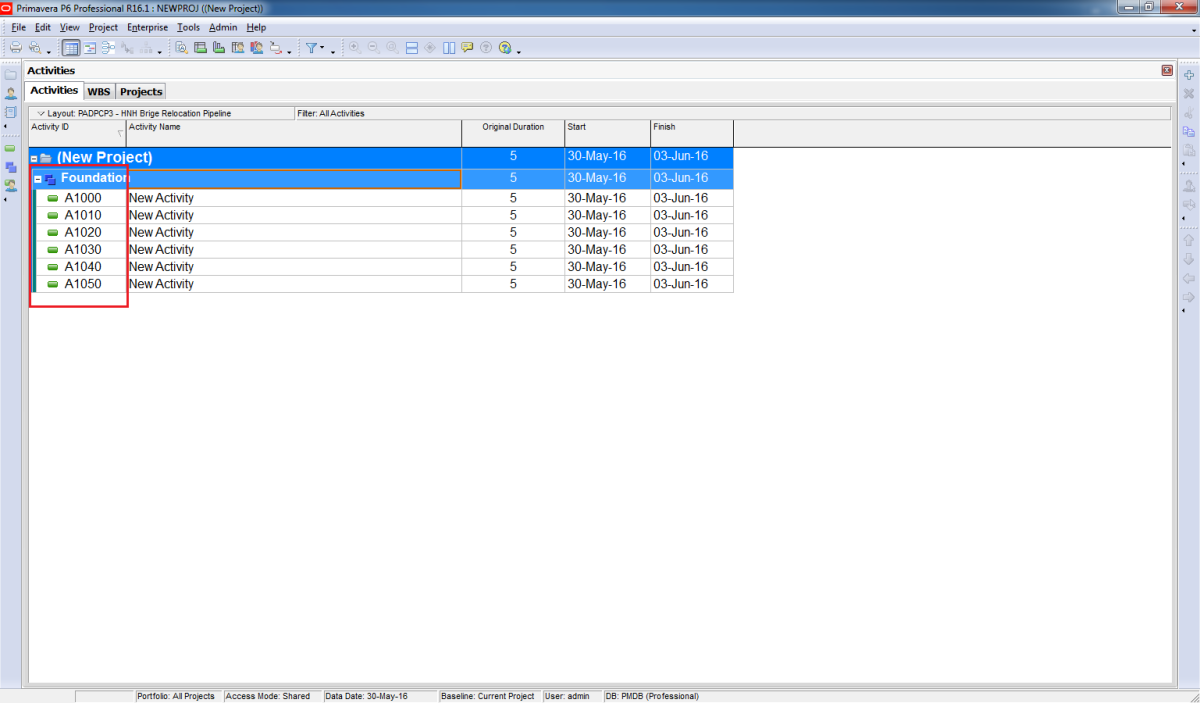
During schedule development stage, say S signifies activities for Standard plant, A for Project A specific, B for Project B specific, and C for Project C specific. S & A are to be clubbed initially and the project plan to be made.
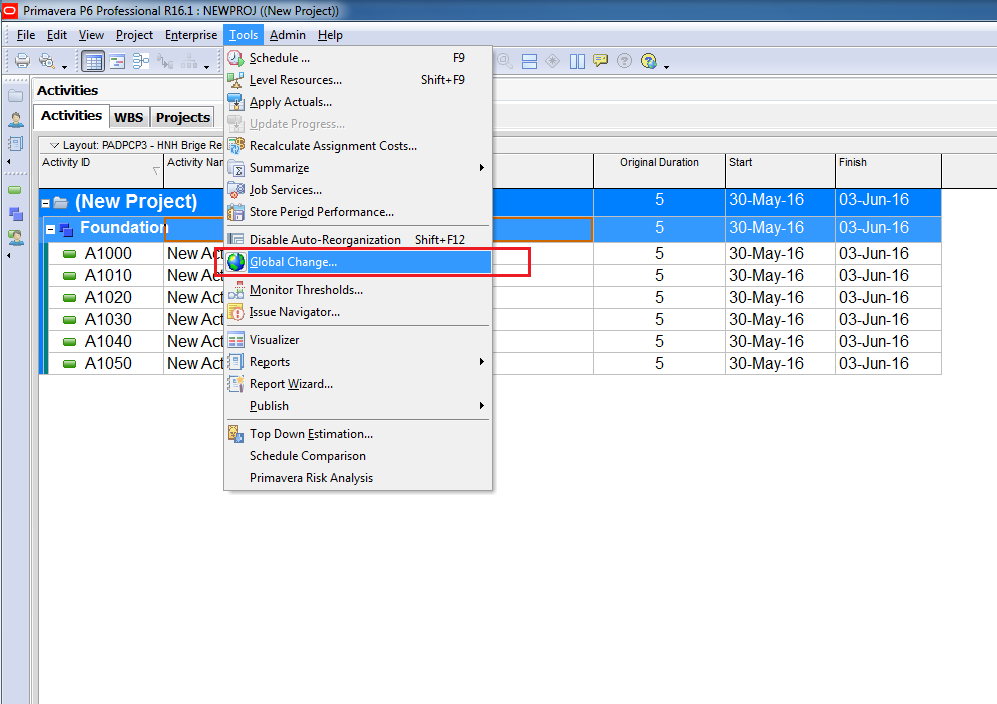
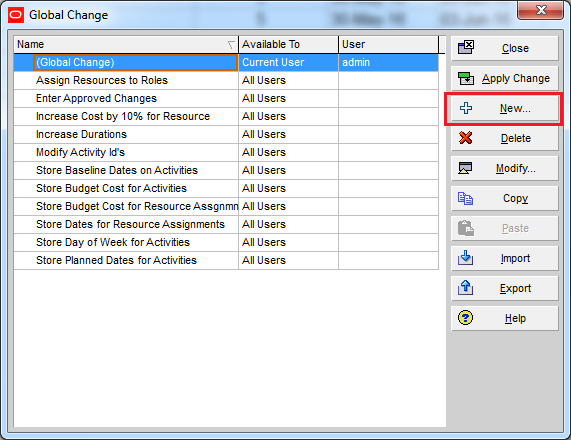
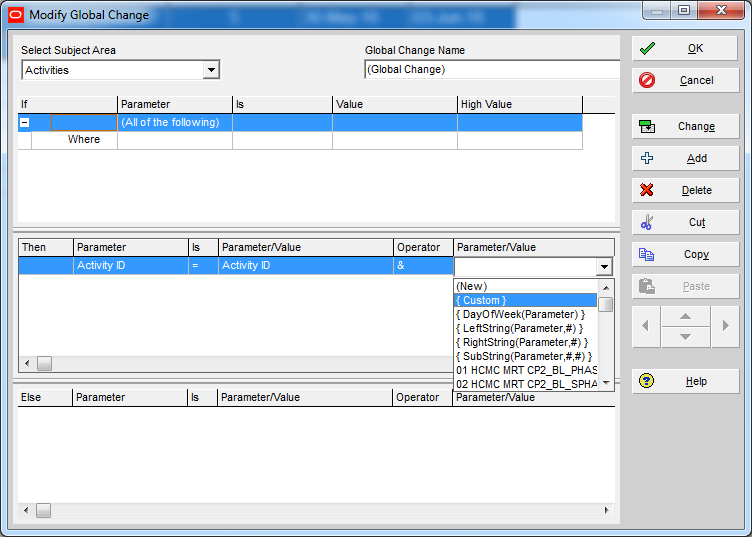
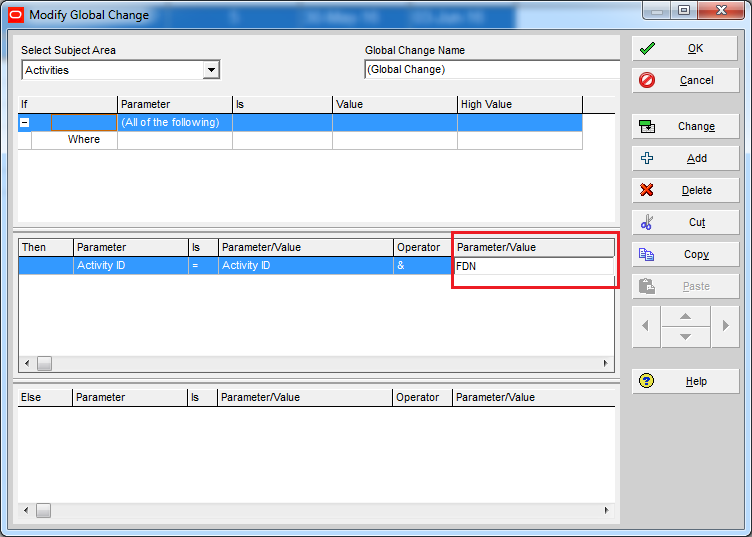
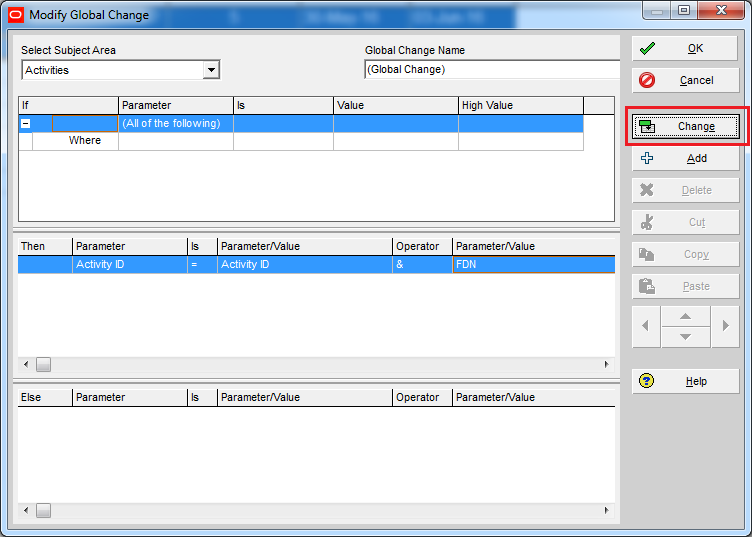
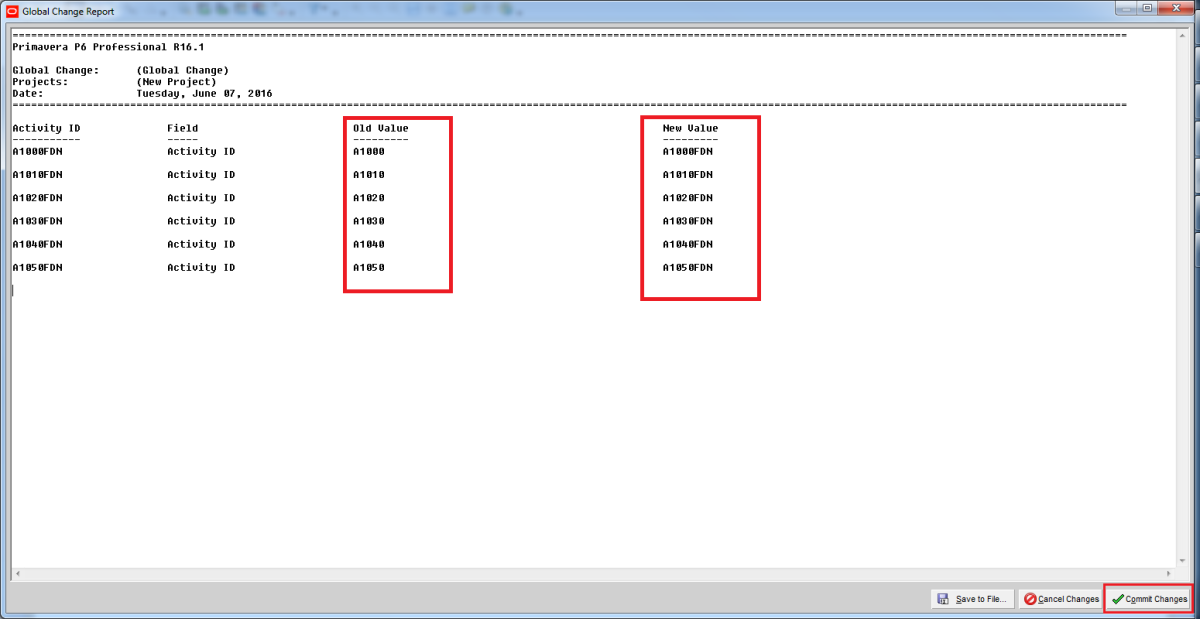
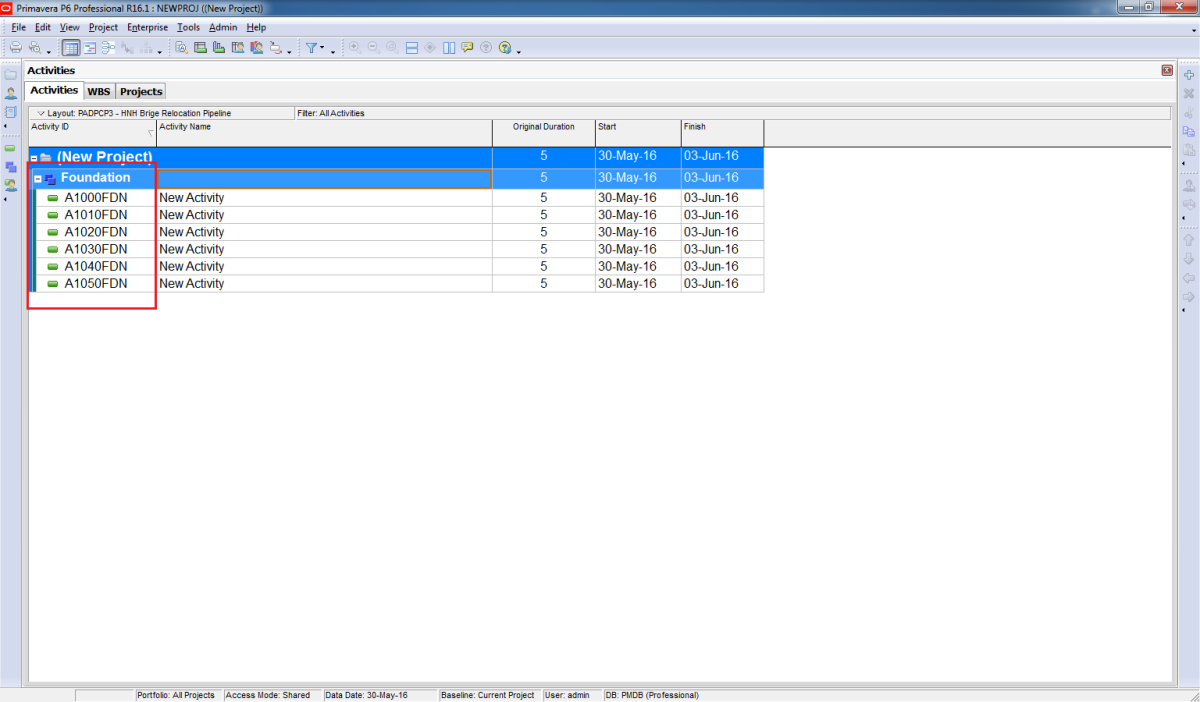
In the beginning, all the “A” project activities will be exactly the same as “B” & “C” project with the exception of the first character in the activity ID “AC” Vs. “BC” for example, one could use the “A” database, global change all the “A” to “B”. This would cause all the standard activities to connect to “B” instead of “A”. One can then just copy & paste into the “B” database.
After developing Standard Plant (S), Project A unit #1 & common activities, they need to be copied to Units 2, 3 & 4. Then A needed to be copied once for B. Lastly, it need to be copied again, but without unit #4 for C as C has got only 3 trains. It is required to keep all relationships within the units as well as relationships to Standard Plant items and Plant common (non-unit specific) items. Additionally, it is also required to keep all the resources and constraints on the copied activities. To achieve this, solution is:
· Create an exact copy of the database (call “HOLD” for discussion purposes).
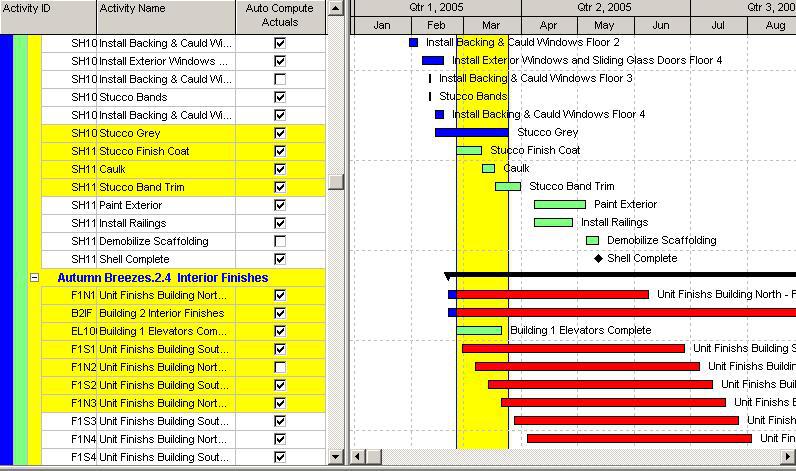
· To copy units, group both databases by unit and tile them in P3 window.
· Run a global change in HOLD to change all Unit #1 activities’ IDs to Unit #2 IDs. Don’t change the activity code to unit #2 …leave as unit #1 to allow you to continue to select unit #1 for copying Units 3 & 4.
· Now copy all these items to the active database by clicking under the group heading of Unit#2 and past external links. This will cause the unit activity code to be updated and b/c the databases are exact copies, the external links to plant common activities will be maintained.
· Once A is created, delete the HOLD database and recreate using the updated database. Use the same concept of global changes & paste external links to make Project B & C.
During maintenance stage, once Project A gets updated which includes standard plant, simple copy the standard plant subproject and paste in Project B & C to avoid duplication of updation of standard plant activities in B & C. Only Project B & C specific activities needs to be updated in these projects.
The benefits in terms of cost are explained in the form of case study in next section.
G: Case Study
The subject of discussion is cost savings made from setting up of 3 Gas based Combined Cycle Power Projects in United States of America. The Owner has decided to set-up 3 power projects (Capacity: Project A=1200MW, Project B=1200MW, & Project C=900MW) simultaneously and called for bids. While calling for bids, following conditions related to standardization were given to bidders:
· Designs for systems/facilities discussed in section D are to be standardized and only replication efforts are to be considered for other 2 projects with minor changes as per the given site conditions.
· Systems/facilities under section E are to be designed separately for all projects.
· Bidders were asked to consider a bulk procurement of all major equipment’s and other purchase on project.
On receipt of bids, owner analyzed substantial savings in set-up cost, which ranges from 16%-19%. The analysis was done on the basis of following information provided by the bidder who finally got the contract.
G.1: Design & Other Home Office support job hours & cost:
On an average 300,000 hours are required to design one power project, which includes the required support from various other disciplines. To design 3 projects (A, B, C) simultaneously, bidder considered that project A would consist of standard design & would require approx. 310,000 hours. The extra efforts of 10,000 hours were considered for developing a replication/cloning system for other projects. Since all the major facilities were standardised & replicated for project B & C, bidder quoted only 180,000 hours each to design project B & C. Going by this calculation, owner analysed the savings of approximately (-10,000+120,000+120,000 = 230,000) hours, which leads to 25% cost savings in job-hours. Comparing against overall project cost, the savings from design engineering were 3% (as engineering constitutes 6%-8% of total project cost).
G.2: Procurement cost:
Here owner noticed that procurement of major equipment’s like Gas Turbines, Heat Recovery Steam Generators, Cooling Towers etc. lead to tremendous savings due to discounts offered by vendors for bulk purchase. Also option of placing a combined order for various bulks like steel, concrete, pipes, cables, conduits and other instrument items resulted in potential cost savings. Here, owner noticed the savings of approx. 20%-25% in bulk procurement cost. As procurement consist of 55%-60% of total project cost, the savings from equipment cost came to 12%-15% on total project.
Total savings from job-hours and procurement showed approx. 16%-19% on total project. From Owners experience, for the above configuration power projects, unit rate for such projects comes to $500-550/KW. By designing and executing multiple (in this case 3) projects simultaneously, owner reduced it to $430/KW (18% savings considered).
G.3: Summary table of savings:
The summary of savings experienced under section G.1 & G.2 are listed below:
Cost Heads
|
Cost Proportion (approx.)
|
Savings
(approx.)
|
Engineering
|
7%
|
3%
|
Power Island equipment
|
60%
|
12%
|
Other purchase
|
10%
|
3%
|
Construction
|
15%
|
Indirect savings*
|
Start up
|
8%
|
Indirect savings*
|
Total Savings: 18% (approx.) + Indirect savings*
* Indirect savings are explained in section I.
Though author has experienced cost and other benefits while going for standardization, various aspects, which can have adverse impact, cannot be neglected and are explained in the next section.
H: Drawbacks
The drawbacks of standardisation of designs are listed here below:
· Very high capital investment is required to execute multiple projects simultaneously.
· Various permits from different governing & regulatory bodies are required due to different geographical locations and may affect standardisation. Also the feasibility of supply of same fuel to all these plant is major concern, which needs to be checked before going for standardisation.
· Site conditions of different locations for e.g., source of water availability, quality of water available, soil condition etc. may have an impact on standardisation.
I: Conclusion:
By setting up multiple power projects simultaneously, the owner can save almost 15% -18% of total capital cost through standardization, undoubtedly a powerful cost saving technique, but requires large capital investment. This capital investment in power sector in any country will attract taxes and duties concessions from the local government, further improving saving in capital cost. Also, by designing multiple projects with one team, organizations can maximize their lump-sum turnkey resources. In the field, construction and start-up best practices & lessons learnt from one project can be directly applied to other sites, which leads to indirect savings. Standardization would help the organizations to successfully implement its strategy to develop large projects while reducing execution costs and providing faster speed to market and greater certainty of outcome. With this standard plant technique, owner is bound to gain an important position and a competitive edge in EPC market.
Acronyms used in the paper:
HRSG : Heat Recovery Steam Generator
CTG : Combustion Turbine Generator
STG : Steam Turbine Generator
GSU : Generator Step-up Transformer
CCW : Closed Cooling Water
UAT : Unit Auxiliary Transformer
LCI : Load Commutated Inverters
CT : Combustion Turbine
ST : Steam Turbine
DCS : Distributed Control System
BOP : Balance Of Plant
TEWAC : Totally Enclosed Water to Air Cooled
CO : Carbon Mono Oxide
HVAC : Heating, Ventilating and Air Conditioning
LAN : Local Area Network
CC : Combined Cycle
EPC : Engineering, Procurement and Construction
KW : Kilo Watt (Unit of measurement of power of Energy)
MW : Mega Watt (Unit of measurement of power of Energy)
ID : Identification number
P3 : Primavera Project Planner (Project Management Software)
BIBLIOGRAPHY
¯ Unpublished company handouts from Project Controls University Classes.
¯ Skills & Knowledge of Cost Engineering – 4th Edition by Dr. Richard E. Larew


 Australia
 International


 Blogs
Blogs Glossary
 Templates
 Videos
 Paperback Literature